
Unlocking data stream processing [Part 2] - realtime server logs monitoring with a sliding window
By Olivier Ruas


Close your eyes and imagine that you are the proud owner of a small e-commerce website that sells very specific products online. You have a beautiful homepage that showcases your latest products, and testimonials of happy clients, and your customers can easily navigate through your site to find what they're looking for. Your website is easy to use, and your customers can easily add products to their cart, check out, and receive their purchases in just a few clicks.
Without you knowing, a famous influencer makes a post about your website: it instantly goes viral. Suddenly, everyone is talking about you on social media, and your website is flooded with traffic. You're getting so many orders that your website, not designed for such peak traffic, becomes unavailable.

This is a simple example of what we call the slashdot effect. When you realize what has happened, it is simply too late: the buzz is over. By the time your website is back online - with an improved bandwidth - the potential new customers are gone and you’ve left revenue on the table. You have missed a unique opportunity for your company.
What could you have done to address such a spike of connections? Having a more powerful hosting plan, a content delivery network (CDN), or a load balancer, let alone a complete solution like Shopify, is too costly for a small business like yours. The solution would be to do some realtime server monitoring.
Regularly monitoring your website's performance can help you detect issues early on and take steps to fix them before they become a problem. Another frequent kind of problem is the deployment of a faulty version - you don't have much time to act then. Detecting such an anomaly only 15 minutes earlier can be enough to avert disasters:
“If you aim for 99.99% availability, you have approximately 15 minutes of error budget per quarter. The build step of rolling forward may take much longer than 15 minutes, so rolling back impacts your users much less.” (from Google SRE Book)
Now, let’s go back to our example and say you had such performance monitoring: you monitor your nginx logs and keep track of how much traffic your website has for the last 5 minutes and an alert is sent if an abnormal increase in traffic is observed. Following the buzz, you receive an Slack notification to inform you about the burst of traffic, allowing you to quickly improve the performance of your website. Your website handles the spikes properly and you fully benefit from the buzz, cashing in revenue.
That’s the power of real-time server monitoring.
The number of connections is an example of a more general problem known as real-time statistical analysis, which computes and maintains different statistics on the latest data points.
You could compute some statistics about your server, such as the median session duration during the past week, or do more advanced techniques, such as anomaly detection. Realtime statistical analysis is challenging and traditional techniques such as sliding windows offer an unsatisfying tradeoff between accuracy and computation costs.
We see how to lift these hurdles by using an open-source library - Pathway. Pathway is a Python framework for realtime data stream processing that handles updates for you. You can set up your processing pipeline, and Pathway will ingest the new streaming data points for you, sending you alerts in realtime.
Let’s dig into realtime statistical analysis!
Slide Your Way to Realtime Statistical Analytics With Window Techniques.
In order to do realtime statistical analysis in streaming systems, such as realtime server monitoring, we only consider the most recent data. Only the most relevant data is kept, i.e. the last ten minutes, and processed in order to detect anomalies or changes in data patterns over time. This portion of the data is called a window. Windows techniques are widely used in stream data processing to analyze and summarize data over a fixed period of time.
A window is a fixed-size buffer that moves through the data stream at regular intervals, typically in a sliding or overlapping manner. As the window moves through the data stream, it collects and processes a fixed number of data items or a fixed duration of data.
The two main windows techniques that are commonly used in stream data processing, are:
1. Tumbling windows: A tumbling window divides the data stream into fixed-size, non-overlapping time intervals. Each window collects and processes a fixed number of data items or a fixed duration of data, after which the window is closed and a new window is opened.
2. Sliding windows: A sliding window moves through the data stream in a fixed-size, overlapping manner. Each window collects and processes a fixed number of data items or a fixed duration of data, after which the window is moved forward by a fixed amount.
For example, you could use tumbling windows to detect suspicious user activity.
For a realtime monitoring, however, you would usually prefer a sliding window over tumbling ones as the latter cut the data in non-overlapping parts: a wrong cut could prevent to detect the spike.
In our website monitoring example, you can decide to send an alert when the number of connections during the window reaches a given threshold. You may have the following situation with a tumbling window:
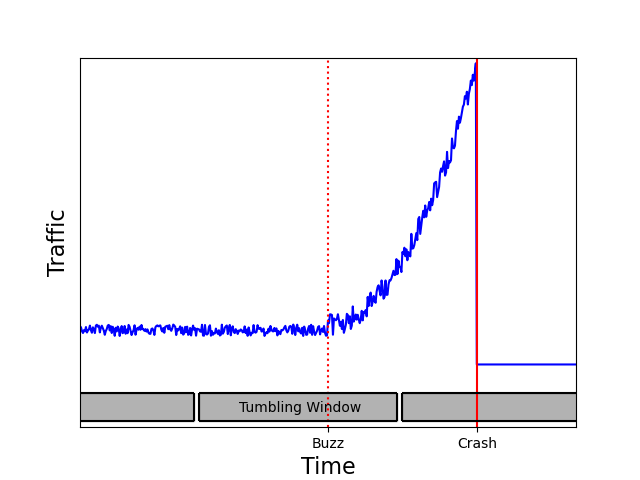
Such a cut can fail to discover a spike soon enough, as there was not enough traffic at the end of the second tumbling window to trigger the alert. By the time the alert is launched by the last window, it will be too late. With a sliding window, you can avoid such a situation:
As you can see, using a sliding window can lower the probability of missing the beginning of an anomaly.
The hidden costs of sliding windows
Sliding windows consider the most recent data at the time of computation: its efficiency will be highly dependent on the timing of the computation. The timing of the start of the window is usually defined by the user, periodically.
If you update the sliding window too often, you will waste a lot of resources, making redundant and useless computations: in the extreme case where there was no data point, computing any sliding window is useless. On the other hand, if you wait too long between two updates you will miss alerts just like with tumbling windows.
Choosing the good timing to compute sliding windows is hard, especially when the data behaves in an unexpected way, which is usually the case when dealing with anomalies.
Realtime sliding window
With Pathway, you can easily make sliding windows which are event-triggered: for example the windows can be updated automatically every time a new data point is received.
Not only the sliding window will be updated whenever a new data point is received, but the computation is not done from scratch, it is updated with the new values: even if the computation is triggered often, its cost is limited.
Let’s now compute such a sliding window using Pathway.
You need two input data streams for your sliding window: one with the events, the new connections to our website for example, one for triggering the computations, containing timestamps. With Pathway, you can easily derive the timestamps datastream from the event one, updating your sliding window whenever a new update is received.
Using Pathway’ connectors you can create two tables containing the two input streams, and then compute the sliding window with them:
import pathway as pw

log_table = pw.connector(input_log_stream)
ts_table = pw.connector(input_ts_stream)
t_sliding_window = sliding_window(log_table, ts_table, 5*60)
You can use two different input streams, choosing the timestamps of `ts_table` yourself (e.g. every five minutes), but as previously said, you can also easily derive the `ts_table` from the `log_table`. Assuming that all timestamps are stored in a column `ts`, you compute `ts_table` as follows:
ts_table = log_table.reduce(ts = pw.reducers.max(pw.this.ts))This will create a table containing the timestamp associated with the latest event in log_table.
Implementing a `sliding_window` function can be done in Pathway with a couple of lines:
def sliding_window(log_table, ts_table, length):
	t_sliding_window = log_table.filter(
pw.this.ts >= ts_table.ix_ref().ts - length
)
return t_sliding_window
Using the sliding window, you can trigger an alert when the number of connections within the last five minutes is higher than a given threshold:
t_alert = t_sliding_window.reduce(count=pw.reducers.count())
t_alert = t_alert.select(
alert=pw.this.count >= alert_threshold
)
Let’s put all the pieces together:
import pathway as pw

log_table = pw.connector(input_log_stream)
ts_table = log_table.reduce(ts = pw.reducers.max(pw.this.ts))
def sliding_window(log_table, ts_table, length):
	t_sliding_window = log_table.filter(pw.this.ts >= ts_table.ix_ref().ts - length)

return t_sliding_window

t_sliding_window = sliding_window(log_table, ts_table, 5*60)
t_alert = t_sliding_window.reduce(count=pw.reducers.count())
t_alert = t_alert.select(
alert=pw.this.count >= alert_threshold
)
Whenever a new data point is received, each table is updated: old entries are left out during the filter in favor of new ones and whenever the number of kept entries is higher than the threshold the alert value is set to true.
The computation on the sliding window is not done from scratch but updated from the previous value, and all of this is automatically handled by Pathway.
Using Pathway’ output connectors, you can output the results to your favorite data storages. You may want to send your statistics about your traffic to ElasticSearch or send alerts messages directly to your slack for better reactivity.
If you want to see how to redirect nginx logs to Pathway using Filebeat and then forward the alerts to a slack channel, check out our full realtime log monitoring example.
Now your site reliability engineers can build sophisticated anomaly detection algorithms and not have to worry about looking for traffic deviations in tools like ElasticSearch.
Conclusion
Realtime statistical analysis is a key part of realtime processing of streaming data.
Such analysis is challenging, and existing windows techniques are limited by the fact that they are triggered periodically, without any awareness of the events. This applies to log, IoT, and semi-structured machine generated data. With streaming data, there will be a time when the setting will lead to either a waste of resources or a loss in accuracy.
With event-based windows, we have efficient computing on latest data.
With Pathway, you can define your pipeline and Pathway will handle the updates for you.
If you come up with your cool anomaly detection model, or simply like to dive deeper into your specific use case, we’d love to hear from you: don’t hesitate to join us on our discord.
All rights reserved ProtoGrowth Inc, India. Links are provided for informational purposes and do not imply endorsement. All views expressed in this newsletter are my own and do not represent current, former, or future employers’ opinions.